Consul End to End: Install, Canary, Lock Down, Monitor
The first instruction in this guide is to not do the thing the other two guides in this series told you to do. Do not install the Gateway API CRDs before Consul. Consul ships its own copy, and an existing installation of the upstream ones puts its API Gateway controller into a crash loop that reports itself as a healthy GatewayClass.
That sets the tone. Consul is the most talkative of the three meshes I have tested, and almost every failure below names its own cause in a message somewhere. The catch is that the messages are in places nobody looks: a SYNCED column, a .status.conditions block, an init container log that scrolls the same line once a second. This guide goes end to end on Consul 2.0.2 and Kubernetes 1.35, on a kind cluster, in about two hours. Every number is measured, including the ones that made me delete a section and write it again.
Before you start
You need Docker, kind, kubectl and Helm. You do not need the consul-k8s CLI to follow this guide, because everything here goes through Helm, but it is worth having for consul-k8s status and it is the one tool people skip:
# macOS or Linux, via Homebrew
brew install hashicorp/tap/consul-k8s

# or pin it explicitly
VERSION=2.0.2
curl -sSLo consul-k8s.zip \
  "https://releases.hashicorp.com/consul-k8s/${VERSION}/consul-k8s_${VERSION}_linux_amd64.zip"
unzip consul-k8s.zip && sudo mv consul-k8s /usr/local/bin/
Check it before going further. The build I ran reports a FIPS suffix, which is normal:
consul-k8s versionconsul-k8s v2.0.2+fips1402The cluster is two nodes on plain kindnet:
kind create cluster --name mesh-consul --image kindest/node:v1.35.0The demo app is four workloads: a backend in two versions serving distinguishable bodies, a flaky workload backed by go-httpbin for controllable failure, and a client that only makes requests. Every workload has its own ServiceAccount, which matters more here than on any other mesh.
Step 1 - Do not install Gateway API, and understand why
Both the Linkerd and Istio guides open by installing the upstream Gateway API CRDs. On Consul that is actively harmful, and it took me three failures to see it.
The Helm chart ships its own copy of five Gateway API CRDs, annotated bundle-version: v0.6.2 and channel: experimental. The chart’s own values file warns you:
# These CRDs can clash with existing Gateway API CRDs if they are already
# installed in your cluster.
manageExternalCRDs: true
If you install upstream Gateway API v1.6.1 first and then run helm install, you get three errors in a row, and only the last one is about Gateway API at all.
It starts with Helm refusing to adopt CRDs it does not own:
Error: INSTALLATION FAILED: unable to continue with install: CustomResourceDefinition
"gatewayclasses.gateway.networking.k8s.io" in namespace "" exists and cannot be
imported into the current release: invalid ownership metadata; label validation
error: missing key "app.kubernetes.io/managed-by": must be set to "Helm"
Nothing there mentions Consul or Gateway API versions. It reads like a labelling problem, so you label them.
Label them and the next refusal is about field ownership:
Error: INSTALLATION FAILED: conflict occurred while applying object
/gatewayclasses.gateway.networking.k8s.io ... Apply failed with 4 conflicts:
conflicts with "kubectl":
- .metadata.annotations.gateway.networking.k8s.io/bundle-version
- .metadata.annotations.gateway.networking.k8s.io/channel
- .spec.versions
That is a direct consequence of the kubectl apply --server-side both earlier guides teach. Helm 4 applies server-side too, and the field manager named kubectl owns .spec.versions.
Force past that and you finally get told what is actually wrong, because upstream Gateway API now ships a ValidatingAdmissionPolicy called safe-upgrades with failurePolicy: Fail:
customresourcedefinitions.apiextensions.k8s.io "referencegrants.gateway.networking.k8s.io"
is forbidden: ValidatingAdmissionPolicy 'safe-upgrades.gateway.networking.k8s.io'
denied request: Installing CRDs with version before v1.5.0 is prohibited by default.
The failure that does not announce itself
I spent a while on a configuration that looks like the right answer: set connectInject.apiGateway.manageExternalCRDs: false so Consul coexists with the upstream CRDs. It installs cleanly. The GatewayClass reports:
NAME     CONTROLLER                                ACCEPTED
consul   consul.hashicorp.com/gateway-controller   True
That is the exact check the Istio guide uses to confirm a good install, and on Consul it is not sufficient. The GatewayClass controller and the Gateway controller are separate processes inside the same pod, and only the first one was running. The injector had six restarts and the previous container’s log said why:
ERROR setup problem running manager {"error": "failed to wait for gateway-v1 caches
to sync kind source: *v1alpha2.TCPRoute: timed out waiting for cache to be synced
for Kind *v1alpha2.TCPRoute"}
Consul detects the tcproutes CRD by name, logs TCPRoute CRD detected - enabling TCPRoute support, and then waits for a v1alpha2 cache. Upstream v1.6.1 serves TCPRoute at v1 only. After about three and a half minutes the manager gives up, the process exits 1, and it starts again. Every Gateway you create sits at Waiting for controller forever.
The mutating webhook is served by that same process, so pod injection keeps working in the gaps between crashes. That is what makes it hard to see.
So: let Consul own those CRDs. If your cluster already has Gateway API for something else, that conflict is real and you will have to resolve it before Consul’s mesh gateway will work at all.
Step 2 - Install Consul, then add the CRD its gateway needs and never installs
The values file is short. Two settings do most of the work:
global:
  name: consul
  datacenter: dc1
  tls:
    enabled: true
  acls:
    manageSystemACLs: true
  metrics:
    enabled: true
    enableGatewayMetrics: true
server:
  replicas: 1
  bootstrapExpect: 1
connectInject:
  enabled: true
  default: false
tls.enabled and acls.manageSystemACLs are what make workload identity real. They are also what makes Consul start closed, which is Step 4. metrics.enabled is false by default and nothing warns you about it; leaving it off means no metrics listener and no Prometheus annotations later.
helm repo add hashicorp https://helm.releases.hashicorp.com
helm install consul hashicorp/consul --version 2.0.2 \
  -n consul --create-namespace -f consul-values.yaml
Three pods, and no DaemonSet, because consul-dataplane talks to the servers directly rather than through a per-node agent:
| Pod | CPU | Memory |
|---|---|---|
consul-server-0 |
19m | 22 Mi |
consul-connect-injector |
4m | 28 Mi |
consul-webhook-cert-manager |
4m | 13 Mi |
| total | 27m | 63 Mi |
The API Gateway will not start on Consul OSS without a manual CRD
This one is worth the section heading. With the CRD versions correct, my Gateway still sat at Waiting for controller, and the reason is that the gateway-v1 controller watches RouteExtProc unconditionally, while the chart only installs that CRD if you have an enterprise licence.
Every other controller started. That one did not. Measured by adding and removing the CRD twice, restarting the injector each time:
routeextprocs CRD |
Controllers reaching “Starting workers” | gateway-v1 among them |
|---|---|---|
| absent | 18 | no |
| present | 19 | yes |
| absent again | 18 | no |
| present again | 19 | yes |
The fix is to render the CRD out of the chart with a dummy licence and apply it. No RouteExtProc object is ever created; the definition only has to exist so the controller’s cache can sync:
helm template consul hashicorp/consul --version 2.0.2 \
  --set global.enterpriseLicense.secretName=dummy \
  --set global.enterpriseLicense.secretKey=dummy \
  -s templates/crd-routeextprocs.yaml | kubectl apply -f -
kubectl rollout restart deployment/consul-connect-injector -n consul
Give it three minutes before judging. I diagnosed this wrong the first time. The controller appeared to be missing, but the pod was actually sitting at Attempting to acquire leader lease because the old replica still held the lock, and no controller at all had started. Leader handover, not a missing CRD. The table above was only produced after allowing time for the lease on every run.
Step 3 - Enrol your app, and meet two rules that are Consul’s alone
Enrolment is an annotation on the pod template, because this install sets connectInject.default: false:
metadata:
  annotations:
    consul.hashicorp.com/connect-inject: 'true'
Two requirements follow, and neither exists on Istio or Linkerd.
Every workload needs its own ServiceAccount. Consul’s Kubernetes auth method binds the Consul service name from the pod’s service account, with a binding rule whose selector is literally serviceaccount.name!=default. A pod on the shared default account can never log in.
Every mesh member needs a Kubernetes Service, including pure clients. Consul registers from Endpoints, so a workload with no Service is never registered and its init container never exits. My client listens on nothing, has no Service in the shared manifest, and sat in Pending indefinitely:
[INFO]  Unable to find registered services; retrying
[INFO]  Check to ensure a Kubernetes service has been created for this application.
Here is the part that will cost you an hour if nobody tells you: that exact message also appears on workloads that are completely healthy. My backend and flaky logged it for 60 to 90 seconds while the endpoints controller caught up, then went 2/2 Running. The message is not a diagnosis. The signal is whether it stops.
The rule hiding behind those two
The Service name and the ServiceAccount name have to match. I found this by pointing a Service named loadgen at pods running under the client account, which put the init container into a restart loop:
[ERROR] Error processing service registration:
        error="service account name client doesn't match Consul service name loadgen"
Consul takes the service name from the Kubernetes Service and the identity from the ServiceAccount, and refuses to register unless they agree. The consequence is worth saying plainly: on Consul, two workloads cannot share a mesh identity. On Istio and Linkerd, any number of Deployments can run under one ServiceAccount and be treated as one caller. Here each one is its own service and needs its own line in policy.
Step 4 - Nothing works now, and that is correct
Enrol the app and every request between meshed pods stops:
client -> backend : curl exit 52, three attempts
client -> flaky   : curl exit 52
This is the opposite of the other two meshes. Istio and Linkerd enrol an app transparently and stay open until you write a policy. Consul enrols your app and cuts its traffic, and you write an intention to get it back.
Be precise about the cause: it follows from acls.manageSystemACLs: true in the values file, which sets the server’s default policy to deny. It is a property of this install, not of Consul in general.
apiVersion: consul.hashicorp.com/v1alpha1
kind: ServiceIntentions
metadata:
  name: backend
  namespace: shop
spec:
  destination:
    name: backend
  sources:
    - name: client
      action: allow
sources.name is the Consul service name, which is both the ServiceAccount and the Service name from Step 3.
One object per destination, and Consul enforces it. A second ServiceIntentions naming the same destination is rejected before it exists:
admission webhook "mutate-serviceintentions.consul.hashicorp.com" denied the request:
an existing ServiceIntentions resource has `spec.destination.name: backend`
So every caller of a service is a list entry inside that service’s single object. This is the pattern for the whole product: Consul is loud in the places the other two are quiet.
Read the SYNCED column, not your curl
The check that matters after applying any Consul config object:
kubectl get serviceintentions -n shopNAME SYNCED LAST SYNCED AGE
backend True 0s 0s
flaky Unknown 0s 0sOn a warm mesh, SYNCED: True and a 200 arrived in the same one-second poll, in both directions, measured across several apply and delete cycles. It is a usable gate rather than a hint. It also catches the failure mode where an object never landed at all, which happened to me once inside a scripted loop that was throwing away its own output.
Step 5 - Tell Consul your services speak HTTP, or half this guide does nothing
This is the largest gotcha in Consul, and it gates two of the four scenarios below.
Consul treats every service as opaque TCP until you say otherwise. With the app meshed and metrics on, I sent 30 requests and watched the counters:
| before | after | |
|---|---|---|
envoy_tcp_downstream_cx_total{envoy_tcp_prefix="public_listener"} |
68 | 84 |
envoy_cluster_upstream_rq{envoy_cluster_name="local_app"} |
17 | 17 |
Connections counted, requests did not, because an L4 proxy has no requests to count. There is no success rate panel to build, no latency histogram, no retries, and no traffic splitting.
The fix is one object per service:
apiVersion: consul.hashicorp.com/v1alpha1
kind: ServiceDefaults
metadata:
  name: backend
  namespace: shop
spec:
  protocol: http
Applying it turned on the entire L7 surface at once:
| before | after | |
|---|---|---|
envoy_cluster_upstream_rq{local_app} |
frozen at 17 | 433 and climbing |
| latency histogram series | 0 | 40 |
| RBAC metric series | 0 | 8 |
I found this the hard way, by applying a ServiceSplitter first and watching traffic carry on round-robining. The splitter told me, in .status.conditions:
Synced=False  reason=ConsulAgentError
message=writing config entry to consul: Unexpected response code: 500
  (discovery chain "backend" uses a protocol "tcp" that does not permit
   advanced routing or splitting behavior)
kubectl get events for that object returned nothing. The reason exists only on the object’s status.
Step 6 - Get metrics, and accept that the mTLS number does not exist
Enabling global.metrics.enabled makes the injector write three annotations onto every meshed pod at injection time, pointing at port 20200 on the proxy:
prometheus.io/scrape = true
prometheus.io/path   = /metrics
prometheus.io/port   = 20200
Existing pods do not get them retroactively. Wait for the injector’s own rollout to finish before restarting your workloads. I restarted mine twelve seconds after the helm upgrade and got pods that were injected, 2/2 Running, and had no annotations and no listener on 20200, because the old injector replica was still serving the webhook. Nothing about those pods looked wrong.
The scrape job is annotation-driven, and the one thing to add is a port filter:
- job_name: 'consul-dataplane'
  kubernetes_sd_configs:
    - role: pod
  relabel_configs:
    - source_labels: [__meta_kubernetes_pod_annotation_prometheus_io_scrape]
      action: keep
      regex: 'true'
    - source_labels: [__meta_kubernetes_pod_annotation_prometheus_io_port]
      action: keep
      regex: '20200'
Keeping only scrape=true is what every tutorial shows and it is too broad. prometheus.io/* is a general convention, not a Consul one, and in the Istio leg of this lab that mistake pulled MetalLB’s three pods in as permanently down targets.
The panel every mesh guide puts first, and why this one cannot
Linkerd and Istio both have a per-request mTLS label whose obvious query lies, and in both cases a filter fixes it. Consul does not have the label at all. This is the complete label set on its data plane metrics:
consul_source_datacenter   consul_source_namespace   consul_source_partition
consul_source_service      envoy_cluster_name        envoy_http_conn_manager_prefix
envoy_listener_address     envoy_rbac_prefix         envoy_response_code
envoy_response_code_class  envoy_tcp_prefix          envoy_tls_certificate
envoy_worker_id            le                        local_cluster
quantile                   version
No security_policy, no tls, no reporter. The only TLS signal is envoy_listener_ssl_handshake, which counts connections. Dividing it by request count gave me 14.5% on a mesh that was encrypting everything, because requests are multiplexed over connections about seven to one. That number is not a percentage of anything.
What is answerable is which listener a request arrived on:
| Listener | Carries | Encrypted |
|---|---|---|
public_listener |
mesh inbound | mTLS enforced |
upstream |
mesh outbound | mTLS |
exposed_path_filter__20400 |
rewritten kubelet probes | plaintext |
envoy_prometheus_metrics |
the metrics port | plaintext |
And the plaintext volume is not a rounding error. Over one window: 716 requests through the mesh, 256 plaintext on the probe port, 20 plaintext on the metrics port. A quarter of the traffic reaching those pods never touched mTLS, and no handshake ratio would have shown it.
Prove the encryption instead of trusting it
Run tcpdump in a privileged DaemonSet on the node, filter to both backend pod IPs, and exclude the two plaintext ports so the capture measures the mesh rather than the probes:
| Run | Packets | Marker in clear | Plaintext GET |
|---|---|---|---|
| mesh path, ports 20200 and 20400 excluded | 352 | 0 | 0 |
| probe port 20400 only | 200 | 20 | 20 |
The second row is the control, and it is not optional. Zero markers is what success looks like and it is also what a capture that never started looks like. Filtering on one backend pod is another way to fool yourself here, because the Service balances across two.
Where each object attaches
Step 7 - Ship a canary
Consul splits this across two objects. A ServiceResolver defines what the subsets are, a ServiceSplitter decides the weights:
apiVersion: consul.hashicorp.com/v1alpha1
kind: ServiceResolver
metadata:
  name: backend
  namespace: shop
spec:
  subsets:
    v1: { filter: 'Service.Meta.version == v1' }
    v2: { filter: 'Service.Meta.version == v2' }
---
apiVersion: consul.hashicorp.com/v1alpha1
kind: ServiceSplitter
metadata:
  name: backend
  namespace: shop
spec:
  splits:
    - { weight: 90, serviceSubset: v1 }
    - { weight: 10, serviceSubset: v2 }
There is a step before this that is easy to miss. Both Deployments register as the same Consul service, because they share the backend ServiceAccount, so there is nothing to select on until the pods carry distinguishing metadata:
metadata:
  annotations:
    consul.hashicorp.com/service-meta-version: v1
Two runs of 200 requests against a requested 90/10:
| Run | v1 | v2 |
|---|---|---|
| 1 | 179 | 21 |
| 2 | 181 | 19 |
Gateway API cannot do this job on Consul
It is reasonable to ask why not use HTTPRoute with weighted backendRefs, which is portable. I tried both ways in.
An HTTPRoute with a Service parentRef, the mesh-routing shape, was accepted by Kubernetes and ignored in silence: status.parents came back empty. No condition, no event, no error. That is the same signature as a wrong Gateway API parent group, and it means the same thing, which is that nothing claimed your route.
Weighted backendRefs needs one Service per version, and that collides with Step 3. Adding a backend-v1 Service alongside backend broke registration on the next restart:
[ERROR] There are multiple Consul services registered for this pod when there must
only be one ... add the label `consul.hashicorp.com/service-ignore: "true"` to all
services except the one used by Consul
Consul names the fix in the error, and taking it closes the door: a Service labelled service-ignore is not a Consul service, so it cannot be a mesh backend.
ResolvedRefs=False  BackendNotFound: shop/backend-v1: backend not found
Accepted=True       Synced=True
The shape of that status is worth noticing, because Accepted and Synced are both True and only ResolvedRefs is false. A reader checking whether the route was accepted gets yes.
So the fork resolves itself. ServiceSplitter is not one of two options, it is the only one, and Consul’s own CRDs reach further anyway: the 90/10 split applied to traffic arriving through the API Gateway in Step 9 with nothing gateway-specific configured, because the split lives in the destination’s discovery chain rather than on a route.
Step 8 - Refuse an unauthorized caller
Deploy a second meshed workload with its own ServiceAccount and no entry in any intention. Without one, a policy that allows the only caller in the namespace proves nothing.
| Caller | Path | Result |
|---|---|---|
client |
the Service | 200 200 200 |
intruder |
the Service | 000 000 000 |
The trap: port 20400 walks around the intention
The same refused pod, asking the backend’s pod IP directly:
kubectl exec -n shop intruder-... -- curl http://10.244.1.42:20400/backend v1Port 20400 is where Consul rewrites the kubelet’s HTTP readiness probe. It carries no mTLS and consults no intention, because the kubelet has no mesh identity and never will.
Consul’s version of this hole is the narrowest of the three meshes, and you set its size. The listener is named exposed_path_filter__20400 and the name is literal: it serves the probe’s exact path and 404s everything else.
| Workload | Probe path | / |
/index.html |
/../etc/passwd |
|---|---|---|---|---|
backend |
/ |
200, 11 bytes | 404 | 404 |
flaky |
/status/200 |
404 | 404 | 404 |
flaky leaks nothing because its probe path returns an empty body. backend leaks its whole response because its probe path is /. So the first fix is free and needs no policy: point the probe at something that returns nothing worth having.
For defence in depth, a NetworkPolicy. Note that it is allow-list based, so naming any ingress rule for these pods closes every port you did not list, including the mesh’s own 20000:
spec:
  podSelector:
    matchLabels: {}
  policyTypes: [Ingress]
  ingress:
    - ports:
        - { protocol: TCP, port: 20000 }
    - from:
        - namespaceSelector:
            matchLabels: { kubernetes.io/metadata.name: monitoring }
      ports:
        - { protocol: TCP, port: 20200 }
There is deliberately no ipBlock for the kubelet. Pinning a probe source range is the standard advice and it is wrong: the address is not stable, and a policy that guesses it becomes an outage the first time a node changes. Measured after applying it, every pod stayed Ready with zero restarts, and:
| Check | Result |
|---|---|
intruder to pod IP :20400 |
exit 28 |
unmeshed pod to :20400 |
exit 28 |
unmeshed pod to :20200 |
exit 28 |
client through the mesh |
200 200 200 |
| Prometheus targets up | 9 |
Step 9 - Let traffic in from outside
A Gateway and an HTTPRoute, and this is the one place Gateway API is the right tool on Consul:
apiVersion: gateway.networking.k8s.io/v1
kind: Gateway
metadata:
  name: shop-gateway
  namespace: shop
spec:
  gatewayClassName: consul
  listeners:
    - name: http
      protocol: HTTP
      port: 8080
      allowedRoutes:
        namespaces: { from: Same }
---
apiVersion: gateway.networking.k8s.io/v1
kind: HTTPRoute
metadata:
  name: backend
  namespace: shop
spec:
  parentRefs:
    - name: shop-gateway
      sectionName: http
  rules:
    - matches:
        - path: { type: PathPrefix, value: / }
      backendRefs:
        - name: backend
          port: 80
Leave parentRefs.group unset. It is the empty string, not core, and writing core is a mistake that cost the Linkerd version of this guide a correction in four places.
Consul provisions a Deployment and a LoadBalancer Service per Gateway, and reports four conditions including two of its own:
Accepted=True        Programmed=True
Synced=True          ConsulAccepted=True
Two things that will look like the gateway is broken
A green route with dead traffic. My first request through the gateway timed out while the HTTPRoute reported ResolvedRefs, Accepted, Synced and ConsulAccepted all True. The cause was the NetworkPolicy from Step 8, whose podSelector is matchLabels: {} and therefore selected the gateway pod Consul had not created yet. Route status describes the route, not the network. Four green conditions and a timeout means look somewhere else. NetworkPolicies are additive, so a second one selecting gateway.consul.hashicorp.com/managed: "true" and allowing 8080 fixes it without loosening anything.
A 403 that looks like a bug. The gateway is an ordinary mesh member, its identity is the Gateway resource’s name, and nothing allowed it:
RBAC: access denied <- http=403Because Consul permits one ServiceIntentions per destination, the ingress step cannot ship as a self-contained manifest. shop-gateway has to be added to backend’s existing object. Worth noticing that the same policy produces two different failures depending on which door you knock on:
| Path | Denied looks like |
|---|---|
| meshed caller to the Service | connection reset, curl exit 52, no body |
| outside caller to the API Gateway | HTTP 403, body RBAC: access denied |
The gateway terminates HTTP and can answer. The sidecar can only hang up.
On kind there is no LoadBalancer, so the Service stays <pending>. MetalLB with a pool from the kind Docker subnet assigned a real address and the Gateway’s status.addresses filled in, and it served 200 from a pod in the node’s network namespace. From my Windows host the same address timed out, because that network lives inside the WSL2 VM. Use kubectl port-forward and move on.
Step 10 - Survive a bad dependency
Consul splits this across two objects with different owners, and getting that backwards is the usual mistake:
| Object | Belongs to | Carries |
|---|---|---|
ServiceRouter |
the destination | numRetries, retryOnStatusCodes, requestTimeout |
ServiceDefaults |
the caller | upstreamConfig.overrides[].passiveHealthCheck |
apiVersion: consul.hashicorp.com/v1alpha1
kind: ServiceRouter
metadata:
  name: flaky
  namespace: shop
spec:
  routes:
    - match: { http: { pathPrefix: /status } }
      destination:
        service: flaky
        numRetries: 3
        retryOnStatusCodes: [503]
    - match: { http: { pathPrefix: /delay } }
      destination:
        service: flaky
        requestTimeout: 1s
Timeouts land where you put them, and return 504 rather than 503:
| Request | Result |
|---|---|
/delay/0 |
200 in 0.007s |
/delay/1 |
504 in 0.966s |
/delay/3 |
504 in 0.962s |
/headers, matching no route |
200 in 0.006s |
Retries do exactly what the arithmetic says, against an endpoint that returns 200 or 503 at random:
| Success out of 60 | |
|---|---|
| no policy | 22 (36.7%) |
| three retries, run 1 | 56 |
| three retries, run 2 | 56 |
| three retries, run 3 | 54 |
That is 90 to 93 percent against a theoretical 93.75 for three retries on a coin flip.
Circuit breaking with the obvious setting destroys the service
Envoy’s default maxEjectionPercent is 10, which on a three-replica service rounds down to zero instances, so ejection appears not to work and the obvious fix is 100. Measured with 100:
| Metric | Value |
|---|---|
envoy_cluster_outlier_detection_ejections_active |
3 |
envoy_cluster_membership_healthy / total |
5 / 8 |
Three of three instances ejected. Three runs of 60 during that window returned 28, then 0, then 0. A service that was succeeding half the time now succeeds never, and the retry policy is useless because there is nothing left to retry against.
The reason is the part worth keeping. Outlier detection assumes some instances are worse than others. All three replicas here are equally flaky, so there is no healthy instance to shift load to, and allowing 100% ejection lets the proxy conclude that nothing is healthy, which is true and useless. Dropping to 34, at most one of three, returned three consecutive runs of 54 out of 60, which is the retries-only figure. On uniform failure the most circuit breaking can do for you is stay out of the way.
Step 11 - Monitoring you can keep
Seven panels, and the first one is the interesting one because it is not the panel you would build on any other mesh.
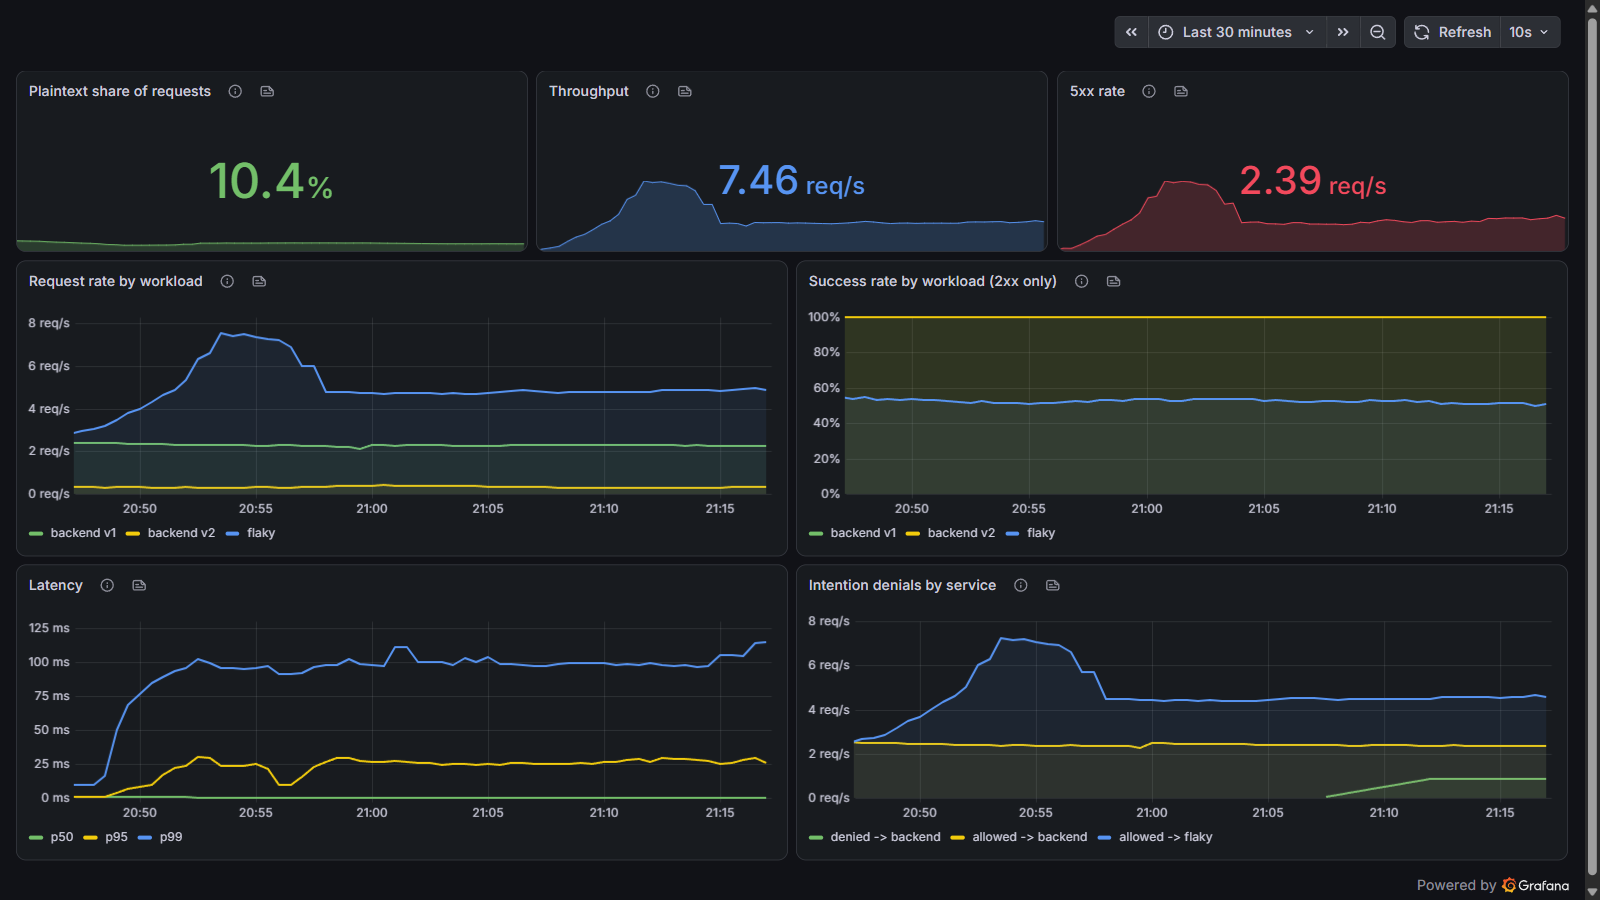
Two panels need explaining rather than copying.
Success rate is 2xx only, deliberately. Counting non-5xx as success hides authorization, because a caller denied through the API Gateway is an ordinary 403 and would read as healthy. Note that backend sits at 100% here even with an intruder hammering it, because Consul’s mesh-internal denial resets the connection and never becomes a request at all.
Denials come from envoy_http_rbac_denied, and it only counts L7 refusals. A service-level intention is enforced at L4: the sidecar closes the connection before any HTTP is spoken, so the counter never moves. To make denials visible you need an L7 intention, which is a genuinely useful feature in its own right:
- name: loadgen-intruder
  permissions:
    - action: allow
      http:
        pathExact: /healthz
That caller asks for /index.html every 1.2 seconds, so scoping its allowance to /healthz denies every request it actually makes, with a real 403 that the counters can see.
Step 12 - Your Kubernetes namespaces are not a boundary
Save this one for last because it changes how you write every policy above.
Consul namespaces are an enterprise feature. On OSS every workload lands in the Consul namespace default regardless of which Kubernetes namespace it lives in, and the identity carries no trace of the Kubernetes one:
spiffe://<uuid>.consul/ns/default/dc/dc1/svc/clientSo I created a namespace called shop-tenant-b, put a ServiceAccount named client and a Service named client in it, and deployed a pod that does nothing. It has no entry in any intention and no relationship to anything.
The Consul catalogue did not gain a second service. Both pods registered as the same one:
| Kubernetes namespace | ServiceAccount | Pod IP |
|---|---|---|
shop |
client |
10.244.1.36 |
shop-tenant-b |
client |
10.244.1.70 |
Then I made it call the protected backend:
| Caller | Namespace | Named in any policy? | Result |
|---|---|---|---|
client |
shop |
yes | 200 |
client |
shop-tenant-b |
no | 10 out of 10, backend v1 |
intruder |
shop |
no | 000 |
A workload in a different namespace, permitted by nobody, got in ten times out of ten, while a workload in the same namespace as the backend was refused. What decided it was the name.
This is not a bug so much as the documented identity model meeting a Kubernetes assumption that does not hold, and on a shared cluster it matters: anyone who can create a namespace with a ServiceAccount and Service of the right name inherits that name’s permissions across the whole datacenter. Istio’s identity is spiffe://cluster.local/ns/<namespace>/sa/<account> and does not have this property.
You get a smaller warning about the same thing if you try to give the tenant its own ServiceDefaults:
admission webhook "mutate-servicedefaults.consul.hashicorp.com" denied the request:
servicedefaults resource with name "client" is already defined - all servicedefaults
resources must have unique names across namespaces
If you run multi-tenant on Consul OSS, service names are a flat global namespace and have to be treated like one. Prefix them per tenant, or budget for Consul Enterprise.
Where to go next
The single thing to take from this guide: on Consul, the object you have not written yet is usually the one breaking the object you have. A ServiceSplitter that quietly does nothing is waiting for a ServiceDefaults to declare a protocol, a workload stuck in Pending is waiting for a Service nobody told you it needed, and a Gateway that never leaves Waiting for controller is waiting for a CRD that only enterprise installs get. Consul had already written down what was wrong in every one of those cases, in a SYNCED column, a .status.conditions block, or an init container log nobody was reading.
So the next action is small, and it is worth building the habit around. Take any Consul config object you have applied and run:
kubectl get serviceintentions,servicedefaults,serviceresolvers,servicesplitters,servicerouters -AIf anything in the SYNCED column says False or Unknown, read its .status.conditions before you touch anything else. That one column would have saved me most of the debugging in this article.