Linkerd End to End: Install, Canary, Lock Down, Monitor
Most service mesh tutorials stop after install and a green check. That leaves you with an encrypted cluster and no idea how to ship a canary, refuse a caller, or tell whether any of it is working. This guide goes all the way through: install, one canary, one authorization policy, one failing dependency survived, and two layers of monitoring.
By the end you will have a mesh where a canary shifts traffic on demand, an unauthorized pod gets a 403, a slow dependency times out instead of hanging, and a Grafana dashboard that does not lie to you. Budget about an hour on a kind cluster. Every command below was run against Linkerd edge-26.7.2 on Kubernetes 1.35, and every number is measured rather than quoted.
Before you start
- A Kubernetes cluster you can install CRDs into. Two nodes is plenty.
kubectlandhelmalready on your path.- An app with at least two services. Mine is a backend serving one line of text in two versions, a
go-httpbindeployment for producing failures on demand, and acurlpod as the client.
The linkerd CLI is the one tool you probably do not have yet, and every step below starts with it:
curl --proto '=https' --tlsv1.2 -sSfL https://run.linkerd.io/install-edge | sh
export PATH=$PATH:$HOME/.linkerd2/bin
linkerd version --client
Client version: edge-26.7.2The installer drops the binary in $HOME/.linkerd2/bin and does not touch your PATH, so put that export in your shell profile or the next command will not find it. Linkerd publishes no stable channel, so edge is the current build rather than a preview, and the installer pins the version you see above. That is the build every number in this guide was measured against.
One decision to make before anything else, because retrofitting it is annoying: give every workload its own ServiceAccount. All three major meshes derive workload identity from it. Leave everything on default and “allow the client” quietly means “allow anything in this namespace”, which is not a policy.
Here is the shape of the app, trimmed to the parts that matter. Deploy it unmeshed first and enrol it in Step 2, so you can see what the mesh changes:
apiVersion: v1
kind: ServiceAccount
metadata: { name: backend, namespace: shop }
---
apiVersion: apps/v1
kind: Deployment
metadata: { name: backend-v1, namespace: shop }
spec:
  selector:
    matchLabels: { app: backend, version: v1 }
  template:
    metadata:
      labels: { app: backend, version: v1 }
    spec:
      serviceAccountName: backend
      containers:
        - name: nginx
          image: nginx:1.27-alpine
          readinessProbe:
            httpGet: { path: /, port: 80 }
---
apiVersion: v1
kind: Service
metadata: { name: backend, namespace: shop }
spec:
  selector: { app: backend }        # both versions, on purpose
  ports: [{ name: http, port: 80, targetPort: 80 }]
backend-v2 is the same with version: v2 and a different response body. The client is a curl image sleeping forever, with its own ServiceAccount. For Step 7 you also want something that fails on demand: mccutchen/go-httpbin serves /delay/5 and /status/200,503 and saves you writing one.
Step 1 - Install Linkerd, and install Gateway API first
Run the pre-check before the install. It catches a real prerequisite:
linkerd check --pre× Gateway API CRDs are installed
The Gateway API CRDs must be installed prior to installing Linkerd.This is not optional and it is not cosmetic. Linkerd has no traffic-split object of its own any more. It uses Gateway API HTTPRoute, which means the CRDs are load bearing for both the canary and the timeout work later in this guide. Install them separately, which is what the tool recommends, rather than letting Linkerd bundle them:
kubectl apply --server-side -f https://github.com/kubernetes-sigs/gateway-api/releases/download/v1.2.1/standard-install.yaml
linkerd install --crds | kubectl apply -f -
linkerd install | kubectl apply -f -
linkerd check
linkerd check should end with Status check results are √. If it hangs rather than failing, that means the control plane is unreachable, not healthy.
Step 2 - Enroll your app
Injection is a namespace annotation plus a restart. Nothing rewrites running pods:
kubectl annotate namespace shop linkerd.io/inject=enabled
kubectl -n shop rollout restart deploy/backend-v1 deploy/backend-v2 deploy/flaky deploy/client
Pods come back 2/2. Confirm the identities are distinct, because everything in Step 5 depends on it:
linkerd identity -n shop $(kubectl -n shop get pod -l app=client -o name | head -1)Subject: CN=client.shop.serviceaccount.identity.linkerd.cluster.localIf that reads default.shop.serviceaccount... for every pod, go back and fix your ServiceAccounts now.
Step 3 - Get metrics before you need them
Install the viz extension. This is the fastest useful thing in Linkerd and it needs no configuration:
linkerd viz install | kubectl apply -f -
linkerd viz check
linkerd viz stat deploy -n shop
NAME MESHED SUCCESS RPS LATENCY_P50 P95 P99
backend-v1 1/1 100.00% 0.2rps 1ms 1ms 1ms
backend-v2 1/1 100.00% 0.2rps 1ms 1ms 1ms
flaky 3/3 100.00% 0.5rps 1ms 1ms 1msGolden metrics per workload, with no scrape config and no instrumentation in your app. Do this early: every step below is easier to verify when you can already see traffic.
Its Prometheus keeps about six hours by default and is not meant to be your long term store. Step 8 replaces it.
Prove the encryption instead of trusting it
linkerd viz will happily tell you traffic is meshed. Checking it with the mesh’s own metrics is a little circular, and it takes about two minutes to check properly.
Run a privileged pod with hostNetwork: true on the node your backend is on. The host ends of every pod’s virtual interface live in the node’s network namespace, so tcpdump -i any there sees pod to pod traffic. Filter to the two pod IPs, send a handful of requests, then grep the capture for your response body.
| Capture | Packets | Response body in clear | Plaintext GET |
|---|---|---|---|
| meshed client to backend | 148 | 0 | 0 |
| unmeshed caller to an unprotected service | 76 | visible | 2 |
The second row is the one people skip, and it is the one that makes the first row mean anything. A capture that never started also reports zero. Point an unmeshed caller at something without a Server object in front of it, confirm you can read the traffic, and only then believe the zero.
Where each object attaches
Before configuring anything, this is the part that trips people up. Linkerd has four features you are likely to want and they bind in three different places, and the object names do not tell you which is which.
Traffic management parents to the Service. Circuit breaking is an annotation on that same Service rather than on the route. Authorization binds to the pod’s port, so it applies no matter how the caller reached you. Keep that picture in mind and the rest of this guide stops feeling arbitrary.
Step 4 - Ship a canary
HTTPRoute backendRefs point at Services, not at label subsets, so each version needs its own Service. Your existing backend Service stops being a load balancer and becomes the route’s parent.
apiVersion: gateway.networking.k8s.io/v1
kind: HTTPRoute
metadata:
  name: backend-canary
  namespace: shop
spec:
  parentRefs:
    - name: backend
      kind: Service
      group: ""
      port: 80
  rules:
    - backendRefs:
        - { name: backend-v1, port: 80, weight: 90 }
        - { name: backend-v2, port: 80, weight: 10 }
Verify with volume, not with one request. Two hundred requests through the route:
| Weights v1/v2 | Result |
|---|---|
| 90 / 10 | 183 v1, 17 v2 |
| 50 / 50 | 51 v1, 49 v2 |
| 0 / 100 | 100 v2 |
Shifting the canary is editing two numbers. Rolling back is editing them again, and it takes effect in seconds without restarting anything.
Step 5 - Refuse an unauthorized caller
Linkerd splits authorization into three objects, which feels heavy until you have several policies sharing one Server:
Servermarks a port as policy controlled. Creating it flips that port to deny by default.MeshTLSAuthenticationnames who a caller is, by mesh identity.AuthorizationPolicybinds the two.
apiVersion: policy.linkerd.io/v1beta3
kind: Server
metadata: { name: backend-http, namespace: shop }
spec:
  podSelector:
    matchLabels: { app: backend }
  port: 80
  proxyProtocol: HTTP/1
---
apiVersion: policy.linkerd.io/v1alpha1
kind: MeshTLSAuthentication
metadata: { name: client-identity, namespace: shop }
spec:
  identities:
    - 'client.shop.serviceaccount.identity.linkerd.cluster.local'
---
apiVersion: policy.linkerd.io/v1alpha1
kind: AuthorizationPolicy
metadata: { name: backend-allow-client, namespace: shop }
spec:
  targetRef:
    group: policy.linkerd.io
    kind: Server
    name: backend-http
  requiredAuthenticationRefs:
    - group: policy.linkerd.io
      kind: MeshTLSAuthentication
      name: client-identity
Test it with a second pod that has a different ServiceAccount. A policy that allows the only caller in the namespace proves nothing.
The trap: your probe path is exempt
My first test said the policy did nothing. The intruder got a 200. It was not a propagation delay and the policy was not wrong:
| Path | client (allowed) | intruder (not allowed) |
|---|---|---|
GET / |
200 | 200, walks straight through |
GET /index.html |
200 | 403 |
Linkerd auto-authorizes the workload’s own probe path for unauthenticated callers from 0.0.0.0/0, so probes keep working after the mesh takes over the pod’s network. My backend’s readiness probe was httpGet: { path: /, port: 80 }, which is an entirely ordinary choice, and / is therefore exempt. Part 1 of this series found all three major meshes doing a version of this.
The fix is in your app, not in the mesh. Give the probe a path that returns nothing worth having:
readinessProbe:
  httpGet: { path: /healthz, port: 80 }
Serve an empty file at that path and re-test:
| Path | client | intruder |
|---|---|---|
GET / |
200 | 403 |
GET /index.html |
200 | 403 |
GET /healthz |
200 | 200, and it is empty |
The backend stayed Ready throughout. Resist the temptation to narrow probeNetworks to your node subnet instead: it looks correct, and about twenty five seconds later the backend fails its own readiness probe and drops out of its Service.
Step 6 - Let traffic in from outside
Linkerd ships no ingress of its own. You bring one and mesh it, and it becomes an ordinary mesh member with an identity.
Do not reach for ingress-nginx here. It was archived on 24 March 2026 and moved to kubernetes-retired: no releases, no bugfixes, no CVE patches. Its maintainers put it plainly, that if you are not already running it you should not deploy it, and should pick a Gateway API implementation instead.
That suits this guide anyway. You already installed the Gateway API CRDs in Step 1, so routing in and routing inside end up on one API rather than two. I used NGINX Gateway Fabric, which keeps NGINX as the data plane and drives it with Gateway API:
kubectl create namespace nginx-gateway
kubectl annotate namespace nginx-gateway linkerd.io/inject=enabled
helm install ngf oci://ghcr.io/nginx/charts/nginx-gateway-fabric -n nginx-gateway
Annotate the namespace before installing so everything in it is injected on creation. Worth checking afterwards: the CRDs stayed on the version Step 1 installed rather than being overwritten.
Now the split Gateway API is built around. The Gateway is infrastructure:
apiVersion: gateway.networking.k8s.io/v1
kind: Gateway
metadata: { name: shop, namespace: nginx-gateway }
spec:
  gatewayClassName: nginx
  listeners:
    - name: http
      port: 80
      protocol: HTTP
      hostname: shop.example.com
      allowedRoutes:
        namespaces: { from: All }
The HTTPRoute is application config and lives with the app:
apiVersion: gateway.networking.k8s.io/v1
kind: HTTPRoute
metadata: { name: backend-external, namespace: shop }
spec:
  parentRefs:
    - { name: shop, namespace: nginx-gateway, sectionName: http }
  hostnames: ['shop.example.com']
  rules:
    - matches: [{ path: { type: PathPrefix, value: / } }]
      backendRefs:
        - { name: backend, port: 80 }
Applying the Gateway makes NGF provision a data plane pod for it, and because the namespace is annotated that pod comes up meshed. Its identity comes from a ServiceAccount created per Gateway and named after it, which is the detail that will bite you:
Subject: CN=shop-nginx.nginx-gateway.serviceaccount.identity.linkerd.cluster.localRename the Gateway and that identity changes, so the policy you are about to write stops matching.
Now send a request from outside and watch Steps 5 and 6 collide:
| From outside, through the Gateway | Result |
|---|---|
| with the policy from Step 5 in force | 403 |
| after adding the Gateway’s identity | 200 |
a request with the wrong Host |
404, refused by the Gateway before the mesh sees it |
| intruder inside the cluster, same moment | 403 |
That 403 is correct behaviour and worth sitting with. Your gateway is not special. It is another workload with another identity, and if your policy does not name it, it does not get in:
identities:
  - 'client.shop.serviceaccount.identity.linkerd.cluster.local'
  - 'shop-nginx.nginx-gateway.serviceaccount.identity.linkerd.cluster.local'
Keep the 404 row separate in your head. Hostname matching is the Gateway’s job and runs before any mesh policy, so a bad Host never reaches a proxy that could evaluate identity.
Step 7 - Survive a bad dependency
Three separate mechanisms, and they are not in the same place. Timeouts are a Gateway API field. Retries are Linkerd annotations on the route. Circuit breaking is an annotation on the Service.
apiVersion: gateway.networking.k8s.io/v1
kind: HTTPRoute
metadata:
  name: flaky-resilience
  namespace: shop
  annotations:
    retry.linkerd.io/http: 5xx
    retry.linkerd.io/limit: '3'
spec:
  parentRefs:
    - { name: flaky, kind: Service, group: "", port: 8080 }
  rules:
    - timeouts:
        request: 2s
      backendRefs:
        - { name: flaky, port: 8080 }
Measured against an endpoint that sleeps for five seconds, and one that fails randomly:
| Measurement | Before | After |
|---|---|---|
/delay/5 with a 2 s request timeout |
200 in 5.09 s | 504 in 1.97 s |
/status/200,503, 30 requests, retry 5xx limit 3 |
16/30 succeeded | 27/30 succeeded |
Retries turned a coin flip into a 90% success rate without touching the application.
Circuit breaking is an annotation on the Service:
kubectl -n shop annotate svc flaky \
  balancer.linkerd.io/failure-accrual=consecutive \
  balancer.linkerd.io/failure-accrual-consecutive-max-failures=3 \
  balancer.linkerd.io/failure-accrual-consecutive-min-penalty=10s
Then trip it and watch what it costs you:
| Step | A request to a healthy path |
|---|---|
| before tripping anything | 200 200 200 |
| immediately after 30 consecutive failures | 503 503 503 503 503 |
| after the 10 s penalty window | 200 200 200 200 200 |
The middle row is the part to understand before you enable this in production. The breaker ejects the endpoint, not the failing route, so healthy requests to the same Service are refused too while the penalty runs. It recovers on its own, and you do not get to keep the good traffic in the meantime.
One honest caveat: I could not find a proxy metric for this. failure_accrual does not appear in the proxy’s metrics at all, so the behavioural test above is the evidence.
Step 8 - Monitoring you can keep
The viz bundle is for looking at something now. For anything you keep, run your own Prometheus and Grafana. The only Linkerd specific part is the scrape config, because Linkerd ships no ServiceMonitor and kube-prometheus-stack scrapes nothing by default:
- job_name: 'linkerd-proxy'
  kubernetes_sd_configs: [{ role: pod }]
  relabel_configs:
    - source_labels:
        - __meta_kubernetes_pod_container_name
        - __meta_kubernetes_pod_container_port_name
        - __meta_kubernetes_pod_label_linkerd_io_control_plane_ns
      action: keep
      regex: ^linkerd-proxy;linkerd-admin;linkerd$
That three label regex is what stops it scraping every port in the cluster. With it, seventeen proxy targets came up, all up=1: seven in the app namespace, three for the control plane, five for viz, and two for the gateway, which is both the NGINX Gateway Fabric controller and the data plane pod it provisioned.
Two facts about Linkerd’s labels decide every query you will write.
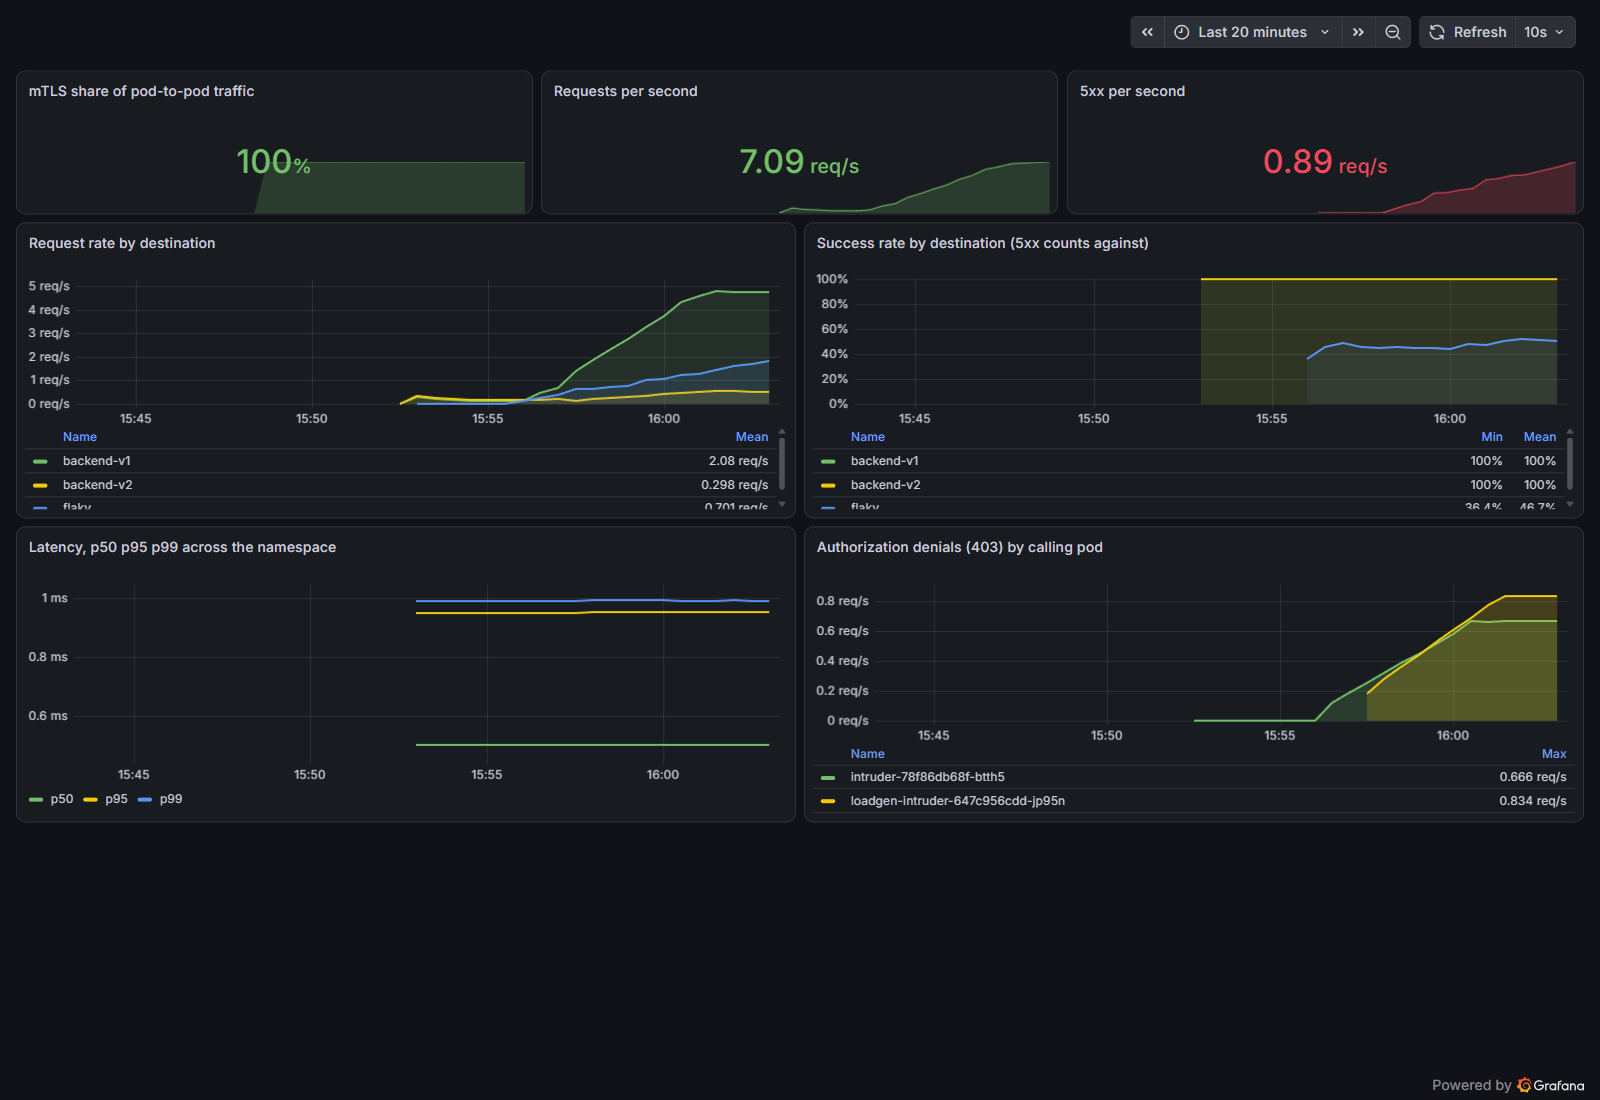
classification="failure" means 5xx only. A 403 is classified as success, because the server answered correctly. Verified directly: the denied calls from Step 5 carry classification="success", status_code="403". So a success-rate panel will not dip when your authorization policy starts refusing traffic. That is usually what you want, and it is startling the first time.
dst_deployment only exists on outbound series. It is the label that answers “who was I calling”. Inbound series describe the callee, so any “what am I depending on” query has to filter to direction="outbound" or it returns nothing useful.
The mTLS panel will lie to you unless you scope it
The obvious query for “how much of my traffic is encrypted” reads 82.4% on a perfectly healthy mesh. The entire shortfall is one thing:
inbound  no_tls_reason=no_tls_from_remote  srv=all-unauthenticated  rate=2.408
inbound  no_tls_reason=no_tls_from_remote  srv=backend-http         rate=0.201
That is the kubelet running health probes. The kubelet is not a mesh member and can never present a mesh certificate, so it drags the ratio down permanently and makes a working mesh look broken. Scope the panel to pod-to-pod traffic and the same mesh reads 100%:
sum(rate(response_total{namespace="shop",direction="outbound",tls="true"}[5m]))
/
sum(rate(response_total{namespace="shop",direction="outbound"}[5m]))
Provision the dashboard as a ConfigMap labelled grafana_dashboard: "1" rather than clicking it together, so it survives the cluster:
apiVersion: v1
kind: ConfigMap
metadata:
  name: linkerd-mesh-dashboard
  namespace: monitoring
  labels:
    grafana_dashboard: '1'
data:
  linkerd-mesh.json: |
    { "title": "Linkerd mesh, golden metrics", ... }
Two panels earn their place beyond the usual rate and latency. One is the mTLS ratio above. The other is authorization denials by calling pod:
sum(rate(response_total{namespace="shop",status_code="403"}[5m])) by (pod)Because 403s are classified as success, that traffic is invisible on every other panel. This is the one that tells you a policy is doing something, or that something has been quietly locked out since Tuesday.
One practical note: generate load with a Deployment, not a backgrounded kubectl exec loop. A process started in an exec session dies with the session, so your metrics stop the moment you look away.
Where to go next
You now have a mesh that shifts traffic on demand, refuses callers by identity, survives a failing dependency, and reports numbers you can defend in an incident review.
The next thing worth doing is deleting your control plane on purpose and watching what still works, because the answer is not what most people expect. That is Part 3 of this series: established connections keep flowing, and Linkerd is the one mesh of the three that admits a new pod with no proxy at all while the injector is down.